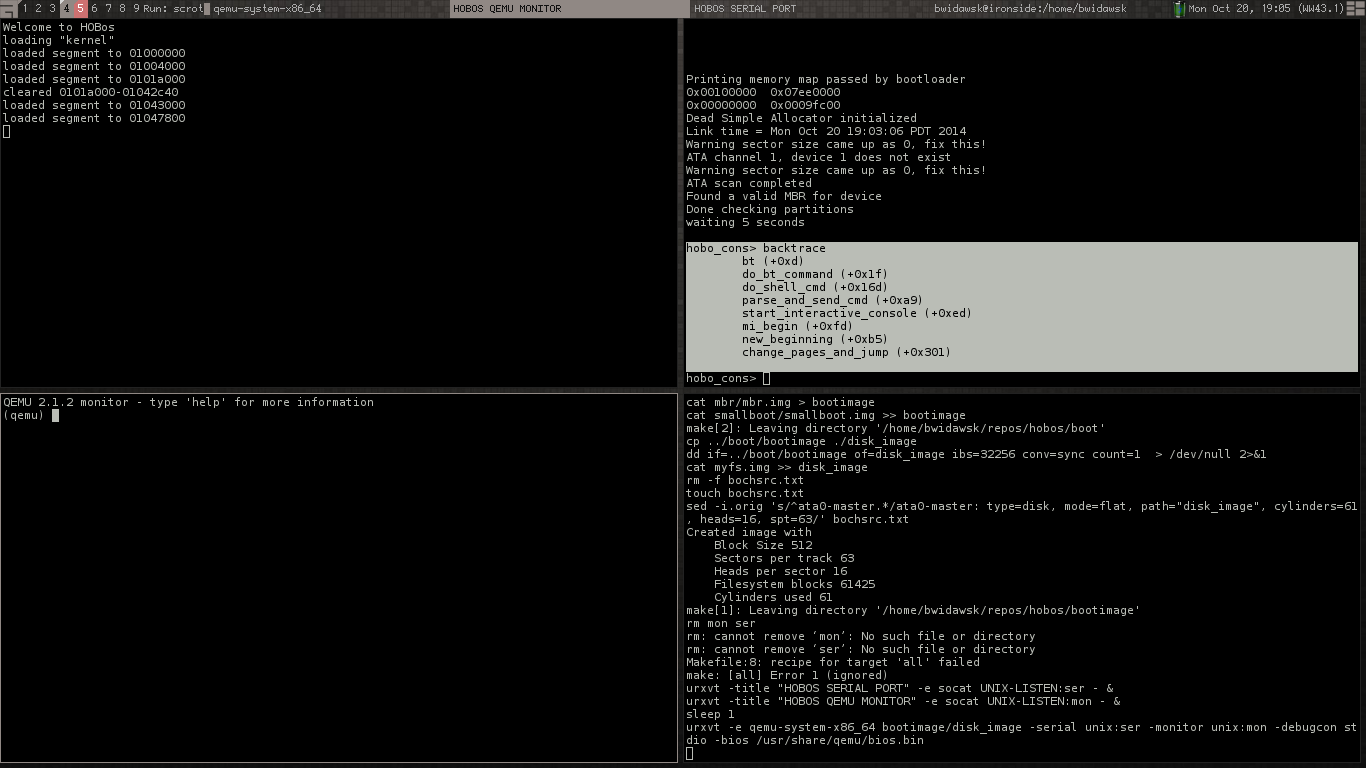
OS backtrace with symbol names
Table Of Contents
For those of you reading this that didn't know, I've had two months of paid vacation - one of the real perks of working for Intel. Today is the last day. It is as hard as I thought it would be.
Most of the vacation was spent vacationing. As I have access to none of the pictures at the moment, and I don't want to make you jealous, I'll skip over that. Toward the end though, I ended up at a coffee shop waiting for someone with nothing to do. I spent a little bit of time working on HOBos, and I thought it could be interesting to write about it.
WARNING: There is nothing novel here.
A brief history of HOBos
The HOBby operating system is an operating system project I started a while ago. I am a bit embarrassed that I started an OS. In my opinion, it's one of lamer tasks to take on because
- everyone seems to do it;
- there really isn't a need, there are many operating systems with permissive licenses already; and
- sites like OSDev have made much of the work trivial (I like to think that when I started there wasn't quite as much info readily available, but that's a lie).
 (not what the project was named after)
HOBos began while I was working on the Larrabee project. The team spent a lot of time optimizing the memory management, and the scheduler for the embedded software. I really wanted to work on these things full time. Unfortunately for me, having had a background in device drivers, I was often required to do other things. As a means to scratch the itch, I started HOBos after not finding anything suitable for my needs. The stuff I found were all either too advanced, or too rudimentary. When I was hired to work on i915, I decided that it was better use of my free time. Since then, I've been tweaking things here or there, and I do try to make sure things still run with the latest QEMU and compilers at least once a year. The last actual feature I added was more than 1300 days ago:
 commit 1c9b5c78b22b97246989b00e807c9bf1fbc9e517
    Author: Ben Widawsky
    Date: Sat Mar 19 21:19:57 2011 -0700

    basic backtrace
So back to the coffee shop. I tried to do something or other, got a hang, and didn't want to fire up GDB.
Backtracing
HOBos had implemented backtraces since the original import from SVN (let's pretend that means, since always). Obtaining a backtrace is actually pretty straightforward on x86.
The stack frame
The stack frame can be thought of as memory contents that are locally scoped to a function. Declaring a local variable will end up in the stack frame. A global variable will not. As functions call other functions, you end up with multiple frames. A stack is used because the last frames added are the first ones removed (this is not always true for things like exceptions, but nevermind that for now). The fact that a stack decrements is arbitrarily chosen, as far as I can tell. The following shows the stack when the function foo() calls the function bar().

void bt_fp(void *fp)
{
    do {
        uint64_t prev_rbp = *((uint64_t *)fp);
    uint64_t prev_ip = *((uint64_t *)(fp + sizeof(prev_rbp))); struct
    sym_offset sym_offset = get_symbol((void *)prev_ip); printf("\t%s
    (+0x%x)\n";, sym_offset.name, sym_offset.offset); fp = (void *)prev_rbp;
    /* Stop if rbp is not in the kernel TODO: need an upper bound too*/
    if (fp <= (void *)KVADDR(DMAP_PML,0,0,0)) break; } while(1); }
The memory contents shown above are created as a result of two things. First is what the CPU implicitly does upon execution of the call instruction. The second is what the compiler generates. Since we're talking about x86 here, the call instruction always pushes at least the return address. The second I'll detail a bit more in a bit. Correlating this to the picture, the green (foo) and blue (bar) are creations of the compiler. The brown is automatically pushed on to the stack by the hardware, and is automatically popped from the stack on the ret instruction.
In the above there are two registers worth noting, RBP, and RSP. RBP which is the 64b extension to the original 8086 BP, Base Pointer, register is the beginning of the stack frame ie the Frame Pointer. RSP, the extension to the 8086 SP, Stack Pointer, points to the end of the stack frame. By convention the Base Pointer doesn't change throughout a function being executed and therefore it is often used as the reference to local variables stored on the stack. -100(%rbp) as an example above.
Digging further into that disassembly above, one notices a pattern. Every function begins with:
push   %rbp       // Push the old RBP, RSP now points to this
mov    %rsp,%rbp  // Store RSP in RBP
Assuming this is the convention, it implies that at any given point during the execution of a function we can obtain the previous RBP by reading the current RBP and doing some processing. Specifically, reading RBP gives us the old Stack Pointer, which is pointing to the last RBP. As mentioned above, the x86 CPU pushed the return address immediately before the push %rbp - which means as we work backwards through the Base Pointers, we can also obtain the caller for the current stack frame. People have done really nice pictures on this - use your favorite search engine.
Here is the HOBos code (ignore the part about symbols for now):
void bt_fp(void *fp)
{
    do {
        uint64_t prev_rbp = *((uint64_t *)fp);
        uint64_t prev_ip = *((uint64_t *)(fp + sizeof(prev_rbp)));
        struct sym_offset sym_offset = get_symbol((void *)prev_ip);
        printf("\t%s (+0x%x)\n", sym_offset.name, sym_offset.offset);
        fp = (void *)prev_rbp;
        /* Stop if rbp is not in the kernel
         * TODO: need an upper bound too*/
        if (fp <= (void *)KVADDR(DMAP_PML,0,0,0))
            break;
    } while(1);
}
As far as I know, all modern CPUs work in a similar fashion with differences sprinkled here and there. ARM for example has an LR register for the return address instead of using the stack.
ABI/Calling Conventions
The fact that we can work backwards this way is a byproduct of the calling convention. One example of an aspect of the calling convention is where to put the arguments to a function. Do they go on the stack, in registers, or somewhere else? In addition to these arguments, the way in which RBP, and RSP are used are strictly software constructs that are part of the convention. As a result, it might not always be possible to get a backtrace if:
- This convention is not adhered to (or -fomit-frame-pointer)
- The contents of RBP are destroyed
- The contents of the stack are corrupted.
How arguments are passed to function are also needed to make sure linkers and loaders (both static and dynamic) can operate to correctly form an executable, or dynamically call a function. Since this isn't really important to obtaining a backtrace, I will leave it there. Some architectures do provide a way to obtain useful backtrace information without caring about the calling convention: Intel's Processor Trace for example.
Symbol information
The previous section will get us a reverse list of addresses for all function calls working backward from a given point during execution. But having names makes things much more easier to quickly diagnose what is going wrong. There is a lot of information on the internet about this stuff. I'm simply providing all that's relevant to my specific problem.
ELF Symbols (linking)
The ELF format provides everything we need (assuming things aren't stripped). Glossing over the details (see this simple tool if you're curious), we end up with two "sections" that tell us everything we need. They are conventionally named, ".symtab", and ".strtab" and are conveniently of type, SHT_SYMTAB, and SHT_STRTAB. The symbol table defines the information about each symbol (functions, variables, whatever). Part of the information is a name, which is an index into the string table. In this simplest case, these are provisions for inter-object linking. If I had defined foo() in foo.c, and bar() in bar.c, the compiled object files can be linked together, but the linker needs the information about the symbol bar (in this case) in order to do its job.
readelf -S a.out
| [NR] | Name | Type | Address | Offset |
|---|---|---|---|---|
| [33] | .symtab | SYMTAB | 0000000000000000 | 000015b8 |
| [34] | .strtab | STRTAB | 0000000000000000 | 00001c90 |
> readelf -S a.out | egrep "\.strtab|\.symtab" | wc -l
2
> strip a.out
> readelf -S a.out | egrep "\.strtab|\.symtab" | wc -l
0
Summing that up, if we have an entire ELF file, and the symbol and string tables haven't been stripped, we're good to go. However, ELF sections are not the unit in which an ELF loader decides what to load. The loader loads segments which are of type PT_LOAD. A segment is made up of 0 or more sections, plus padding. Since the Operating System is itself an ELF loaded by an ELF loader (the bootloader) we're not in a good position. :(
> readelf -l a.out | egrep "\.strtab|\.symtab" | wc -l
0

Debug Info
Note that what we want is not the same thing as debug information. If one wants to do source level debug, there needs to be some way of correlating a machine instruction to a line of source code. This is also a software abstraction, and there is usually a spec for it unless you are using some proprietary thing. It would technically be possible to include DWARF capabilities within the kernel, but I do not know of a way to get that info to the OS (see multiboot stuff for details).
From boot to symbols
The HOBos project implements a small Multiboot compliant bootloader called smallboot. When the machine starts up, boot firmware is loaded from a fixed location (this is currently done by SeaBIOS). The boot firmware then loads the smallboot bootloader. The bootloader will load the kernel (smallboot, and most modern bootloaders will do this through a text configuration file on the resident filesystem). In the HOBos case, the kernel is simply an ELF file. smallboot implements a basic ELF loader to load the kernel into memory and give execution over.
The multiboot specification is a standardized communication mechanism (for various things) from the bootloader to the Operating System (or any file really). One of these things is symbol information. Quoting the multiboot spec
If bit 5 in the 'flags' word is set, then the following fields in the Multiboot information structure starting at byte 28 are valid:
         +-------------------+
 28      | num               |
 32      | size              |
 36      | addr              |
 40      | shndx             |
         +-------------------+
These indicate where the section header table from an ELF kernel is, the size of each entry, number of entries, and the string table used as the index of names. They correspond to the 'shdr_*' entries (‘_shdrnum') in the Executable and Linkable Format ([
ELF]) specification in the program header. All sections are loaded, and the physical address fields of the [ELF] section header then refer to where the sections are in memory (refer to the i386 [ELF] documentation for details as to how to read the section header(s)). Note that '_shdrnum' may be 0, indicating no symbols, even if bit 5 in the 'flags' word is set.
Since the beginning I had implemented these fields in the bootloader:
multiboot_info.flags |= MULTIBOOT_INFO_ELF_SHDR;
multiboot_info.u.elf_sec = *table;
Because of the fact that the symbols weren't in the ELF segments though, I was stumped as to how to get at the data one the OS is loaded. As it turned out, I didn't actually read all 4 sentences and I had missed one very important part.
All sections are loaded, and the physical address fields of the [
ELF] section header then refer to where the sections are in memory
What the spec is dictating is that even though the sections are not in loadable segments, they shall exist within memory during the handover to the OS, and the section header information will be updated so that the OS knows where to find it. With this, the OS can copy out, or just make sure not to overwrite the info, and then get access to it.
for (i = 0; i < shnum; i++) {
    __ElfN(Shdr) *sh = &shdr[i];
    if (sh->sh_size == 0)
        continue;

    if (sh->sh_addr) /* Already loaded */
        continue;

    ASSERT(sizeof(void *) == 4);
    *((volatile __ElfN(Addr) *)&sh->sh_addr) = sh->sh_offset + (uint32_t)addr;
}
et cetera
The code for pulling out the symbols is quite a bit longer, but it can be found in kern/core/syms.c. With the given RBP unwinder near the top, we can easily get the IP for the caller. With that IP, we do a symbol lookup from the symbols we got via the multiboot info.